Visualising AI spending: How does it compare with history’s mega projects?
 19 February 2026

World leaders and tech executives are convening in New Delhi for the India-AI Impact Summit 2026, focusing on the role of artificial intelligence in governance, job disruption and global collaboration.
However, behind these discussions lies the financial reality. Over the past decade, AI has drawn one of the largest waves of private investment in modern history, totalling trillions of dollars.
According to Gartner, a United States-based business and technology insights company, worldwide spending on AI is forecast to total $2.5 trillion in 2026, a 44 percent increase over 2025.
To understand the magnitude of these investments, Al Jazeera visualises the staggering amounts by comparing them with some of the largest projects ever created by humanity. We also highlight which countries are spending the most on AI and provide insights into expenditures on data centres, models, services, and security.
What does $1bn look like?
To help understand a trillion dollars, it is useful to first visualise what millions and billions of dollars look like by using a stack of US dollar bills.
If you break these amounts down using $100 bills, here is how they stack up:
- $1,000 would form a stack about 1cm (0.393-inch) high.
- $10,000 would form a stack approximately 10cm (3.93-inch) high.
- $1m would fit inside a briefcase.
- $10m would fit inside a very large suitcase.
- $100m would fit on an industrial pallet stacked waist-high.
- $1bn would create a building approximately 5.2 metres (17 feet) high, with a width and a length of about 2 metres (6.6 feet) each.

Another way to think of it is if you spent $1 every second, it would take:
Advertisement
- 11.5 days to spend $1m
- 31 years to spend $1bn
- 31,000 years to spend $1 trillion
In more tangible terms, $1bn is roughly equivalent to:
- The estimated cost of the Grand Egyptian Museum in Giza, one of the largest archaeological museums in the world
- The cost of constructing two to three modern football stadiums, depending on size and design
- Buying 10 luxury private jets (at $100m each)
- Buying 6.3 tonnes of gold (at $5,000 per ounce)
- Buying 1 million high-end iPhones at retail price
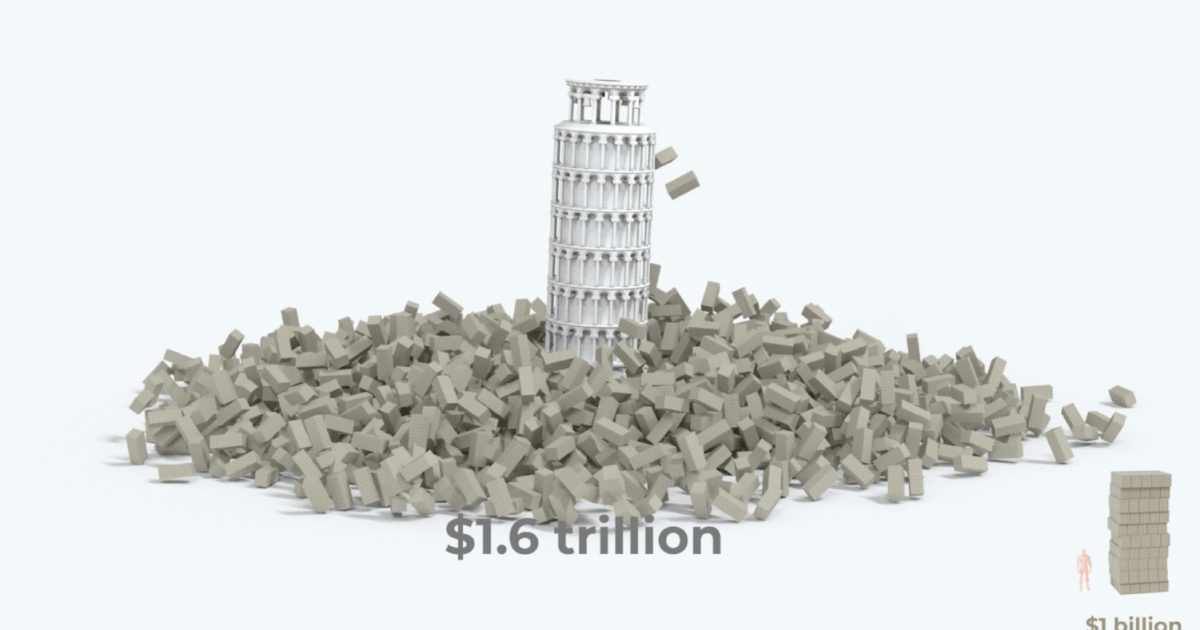
$1.6 trillion already spent on AI
Over the past decade, AI-related investments have surged nearly 13-fold.
According to the 2025 AI Index Report by Stanford University, between 2013 and 2024, total global corporate investment in AI reached $1.6 trillion. This substantial expenditure dwarfs even the largest scientific and infrastructure projects of the 20th and 21st centuries.
To put the scale of AI investment into perspective, consider how it compares with some of the most ambitious and expensive projects in modern history. All figures are adjusted to 2024 US dollars:
- The Manhattan Project (1942-46): $36bn
- The International Space Station (1984-2011): $150bn
- The Apollo Program (1960-73): $250bn
- The US Interstate Highway System (1956-92): $620bn

In just over a decade, investment in AI has surpassed the cost of developing the first atomic bomb, landing humans on the moon and the decades-long effort to build the 75,440km (46,876-mile) US interstate highway network.
Unlike these landmark projects, AI funding has not been driven by a single government or wartime urgency. It has flowed through private markets, venture capital, corporate research and development, and global investors, making it one of the largest privately financed technological waves in history.
Global corporate investments in AI cover a vast array of operations, including mergers and acquisitions, minority stakes, private investments, and public offerings. These monumental expenditures highlight the extensive financial commitment to advance AI.
Which countries are spending the most on AI?
The AI investment surge is concentrated in just a few countries, where private capital has fuelled thousands of startups and shaped global innovation hubs.
The US has dominated AI spending, accounting for roughly 62 percent of total private AI funding since 2013. Between 2013 and 2024, US companies spent $471bn on AI. Chinese companies are the second-largest spenders at $119bn, followed by the United Kingdom at $28bn.
These figures exclude government spending, such as the US CHIPS Act or European national AI subsidies.
Advertisement
Global private investment in AI by country, 2013-24:
- US: $471bn, supporting 6,956 newly funded AI companies
- China: $119bn, 1,605 startups
- UK: $28bn, 885 startups
- Canada: $15bn, 481 startups
- Israel: $15bn, 492 startups
- Germany: $13bn, 394 startups
- India: $11bn, 434 startups
- France: $11bn, 468 startups
- South Korea: $9bn, 270 startups
- Singapore: $7bn, 239 startups
- Others: $58bn

AI spending to total $2.5 trillion in 2026
AI spending is forecast to skyrocket to $2.5 trillion in 2026, driven by a massive global build-out of data centres and services, according to Gartner.
The bulk of the spending is expected to go towards:
- AI infrastructure: $1.37 trillion
- AI services: $589bn
- AI software: $452bn
- AI cybersecurity: $51bn
- AI platforms for data science and machine learning: $31bn
- AI models: $26bn
- AI application development platforms: $8.4bn
- AI data: $3bn
By 2027, Gartner is forecasting that AI spending will surpass $3.3 trillion.

Related News
Bangladesh election: Who are the key players and parties?
Japan votes as first female leader hopes her party secures big win
Epstein files reveal web of relationships among rich and powerful